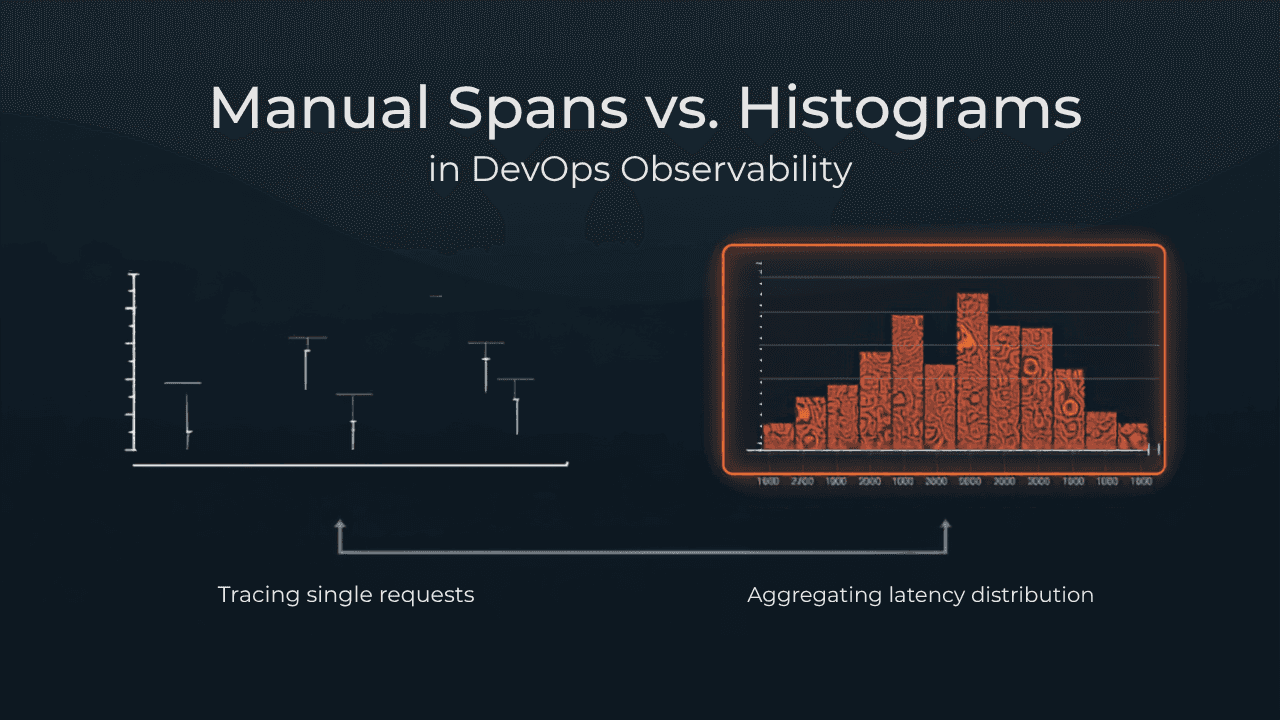

Modern observability is more than collecting logs, metrics, and traces independently. The real value comes from correlating all three telemetry signals, allowing engineers to move seamlessly from a Grafana dashboard to a distributed trace and finally to the exact log entry that explains the failure.
This section covers the instrumentation practices that make that possible, including manual spans, exemplars, telemetry correlation, and production-ready OpenTelemetry configuration.
Manual Spans for Business Logic
Auto-instrumentation provides excellent visibility into infrastructure boundaries such as:
Incoming HTTP requests
Database queries
Message queues
External API calls
However, it has no understanding of your application's business logic.
For example, imagine an order processing service:
Receive Order
      |
 Validate Payment
      |
   Cook Order
      |
 Package Order
      |
 Deliver
Without manual instrumentation, a trace only shows HTTP handlers and database calls. It cannot explain which business step consumed the most time or where the request failed.
Manual spans solve this problem by explicitly marking important business operations.
func cookOrder(ctx context.Context, orderID string) error {
    tracer := otel.Tracer("platform-api")

    ctx, span := tracer.Start(ctx, "cook_order",
        trace.WithAttributes(
            attribute.String("order.id", orderID),
        ),
    )
    defer span.End()

    if err := runOven(ctx, orderID); err != nil {
        span.RecordError(err)
        span.SetStatus(codes.Error, "oven failure")

        logWithTraceContext(ctx, logger,
            "order burned",
            "order_id", orderID,
            "reason", "oven_failure",
        )

        return err
    }

    return nil
}
The cook_order span becomes a child of the incoming HTTP request span, making the entire operation visible inside the distributed trace.
More importantly, when an error occurs:
span.RecordError()records the exception.span.SetStatus(codes.Error, ...)marks the span as failed.The log entry carries the same
trace_id, allowing logs and traces to be correlated.
Because all telemetry shares the same trace context, engineers can quickly locate failed requests, filter traces in Tempo, and inspect the associated logs in Loki without manual searching.
Recording Errors Correctly
Simply returning an error is not enough.
OpenTelemetry only knows a span failed if the instrumentation explicitly reports it.
span.RecordError(err)
span.SetStatus(codes.Error, "oven failure")
These two calls provide several operational benefits:
Failed traces become searchable in Tempo.
Tail-based sampling can prioritize retaining error traces.
Error rates become visible in tracing dashboards.
Root-cause analysis becomes significantly faster.
When paired with structured logging, every error log contains the same trace_id as the trace itself.
Trace
 ├── HTTP Request
 ├── Validate Payment
 ├── Cook Order ❌
 └── Database

|

Log

trace_id=abc123
order_id=42
reason=oven_failure
A trace immediately points to the relevant logs, and the logs point back to the originating trace.
Linking Metrics to Traces with Exemplars
Metrics summarize system behavior across thousands or millions of requests.
Sometimes, however, an engineer needs to inspect one specific request that contributed to a latency spike.
This is where exemplars become invaluable.
When a histogram metric is recorded from a context containing an active span, the OpenTelemetry SDK automatically attaches the current trace ID as an exemplar.
histogram.Record(
    ctx,
    cookDurationSeconds,
    metric.WithAttributes(
        attribute.String("service.name", "platform-api"),
    ),
)
No additional code is required beyond passing the correct context.Context.
As long as the context contains an active span (created by otelgin middleware or a manual span), the metrics SDK automatically associates the trace with the recorded histogram sample.
Viewing Exemplars in Grafana
When Prometheus is configured with exemplar support and Grafana has Tempo connected, histogram panels display small diamond markers representing individual trace samples.
The workflow becomes remarkably simple:
Histogram
     |
Latency Spike
     |
Click Exemplar
     |
Tempo Trace
     |
Problem Span
Instead of investigating hundreds of traces, engineers can jump directly from an anomalous metric to the exact request responsible for that data point.
This dramatically reduces the time required to diagnose production issues.
The Complete Correlation Workflow
True observability is achieved only when logs, metrics, and traces are fully connected.
The complete request lifecycle looks like this:
Incoming Request
The request reaches
backend-api, whereotelginmiddleware automatically creates the root span and generates atrace_idandspan_id.Structured Logging
Every log emitted during request processing includes the active
trace_idandspan_id.Business Logic Instrumentation
Manual spans record meaningful application stages such as payment validation, order cooking, or report generation. Errors are recorded directly on the spans.
Metric Collection
Histogram metrics record latency and automatically attach exemplars that reference the active trace.
Grafana Investigation
An engineer begins with a dashboard showing elevated latency. By clicking an exemplar, Grafana opens the corresponding Tempo trace. From there, selecting a span reveals the associated Loki logs filtered by the same
trace_id.
The investigation flow becomes:
Grafana Metric
        |
    Exemplar
        |
   Tempo Trace
        |
    Failed Span
        |
     Loki Logs
This seamless navigation is the foundation of efficient production troubleshooting. It only works when every service consistently propagates trace context, records meaningful spans, emits structured logs, and records metrics using the active request context.
Instrumentation Standards
The following standards should be applied consistently across every service before deployment.
Avoid Logging Every HTTP Request
HTTP request counts, latency, throughput, and error rates are already captured by metrics.
Creating a log entry for every request adds significant storage cost while providing little additional operational value.
Use metrics for request volume and logs only for meaningful events such as:
Errors
Unexpected behavior
Security events
Business actions requiring audit trails
Avoid High-Cardinality Metric Labels
Metrics are optimized for aggregation.
Labels containing values such as:
User IDs
Session IDs
Email addresses
Order IDs
dramatically increase storage requirements and reduce query performance.
Keep metric labels low in cardinality:
Service name
HTTP method
Endpoint
Status code
Environment
Detailed identifiers belong in logs or trace attributes—not in metric labels.
Never Emit Logs Without Trace Context
Logs without a trace_id cannot be correlated with the originating request.
Every production service should ensure:
Trace context propagates across service boundaries.
Logging libraries automatically include the active
trace_id.Background jobs preserve trace context where applicable.
Without trace correlation, logs become isolated records rather than part of a complete observability workflow.
OpenTelemetry SDK Configuration Checklist
When instrumenting a new service, configure the OpenTelemetry SDK in the following order.
Configure Resource Attributes
Every telemetry signal should identify its source.
At minimum, configure:
service.nameservice.versiondeployment.environment
Include organization-specific attributes where appropriate, such as project or application identifiers. These attributes are inherited by every span, metric, and log emitted by the service.
Enable Auto-Instrumentation First
Always start with auto-instrumentation for:
HTTP servers
HTTP clients
Database drivers
Message queues
RPC frameworks
Only add manual spans where business logic requires additional visibility.
3. Verify Context Propagation
Context propagation is one of the most common sources of incomplete traces.
Verify that trace context flows correctly through:
HTTP headers
gRPC metadata
Message queues
Background workers
Logging frameworks
Never assume propagation works—test it explicitly.
4. Configure Sampling
Sampling should be configurable through the deployment environment rather than hardcoded.
Recommended approaches include:
Tail sampling in production when infrastructure supports it.
Head sampling with an appropriate sampling ratio otherwise.
Choose the strategy that balances observability requirements with storage costs.
5. Use a Batch Span Processor
Production services should use the Batch Span Processor, which exports telemetry asynchronously and minimizes request latency under load.
Reserve the Simple Span Processor for local development and debugging, where immediate span export is more valuable than throughput.
Use Environment Variables for Configuration
Avoid hardcoding service identity or exporter endpoints.
Instead, rely on the standard OpenTelemetry environment variables, including:
OTEL_SERVICE_NAMEOTEL_EXPORTER_OTLP_ENDPOINTOTEL_TRACES_SAMPLEROTEL_RESOURCE_ATTRIBUTES
This approach allows the same application build to run unchanged across development, staging, and production environments.
Enable Debug Exporters During Development
During initial instrumentation, enable the console or debug exporter to verify that spans, metrics, and logs are generated correctly and include the expected attributes.
Before deploying to production, disable these exporters and use the configured OTLP exporter instead. Debug exporters are intentionally verbose and are not suitable for production workloads.